Select date

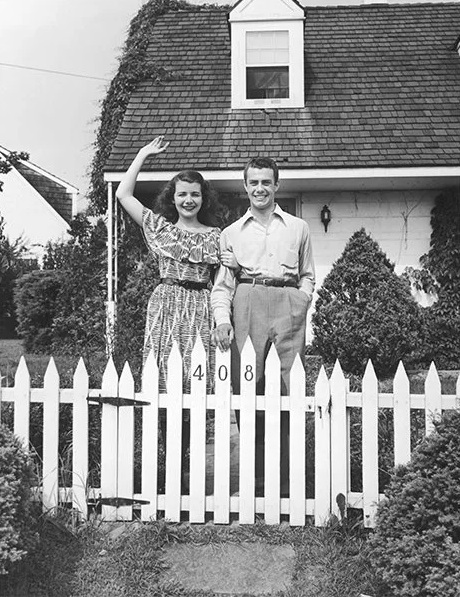
The Fading Memory of American Homeownership


 2,459 words
Several trends in the United States related to home ownership are developing that I find rather startling. Some of those trends have been slow, taking decades to mature, and perhaps have been noticed by many. Other trends are more acute temporally, springing up only over the past few years. These trends have altered the landscape of home ownership, and overall have made home ownership and housing security far more difficult for most Americans.
One of the first pieces of data I came across that struck me as significant was a 2018 chart showing that across the United States, the length of time needed to save for a 20% down payment on a home has increased by 1.5 years over the past 30 years. In 1988, with an average household income of $28,100, it took 5.7 years of savings to have 20% to place on the average home. In 2018, it was 7.2 years, with some more expensive cities outpacing this rate by several times.[1] Some studies show an even more extended amount of time needed to save for a down payment, reporting a more than ten-year average, compared to 6.4 years in 1971.[2]
The principal reason for this increased savings time and lack of general affordability is the relationship between household income and home prices.
In 1960 the average household income was $5,600, and the average cost of a home was $11,900. These figures created an average ratio of house price to income of 2.125 (found by dividing the average house price of $11,900 by the average income of $4,600).
Price-to-income ratio is a commonly used metric in the housing market as well as finance. The price-to-income ratio stems from the general guideline that housing costs, whether rentals or a mortgage, and related expenses should not exceed 30% of the household’s gross income. As such, if a household spends around 30% of their income on a home mortgage, they can comfortably afford a home that costs about 2.6 times the amount of one year’s income. The average price-to-income ratio in the United States is today around 4.5, with a median ratio of 3.8, reaching historic highs.[3]
A quick example of how the 30% rule and 2.6 times one year’s income works: If the median household income is $67,000, 30% of its gross income would be $20,100, divided by twelve months; that is, $1,675 per month for a mortgage, insurance, and property taxes. If we multiply $67,000 by 2.6, the cost of the house that would be affordable within the 30% guideline, we get $174,200. A 30-year fixed rate mortgage on that amount is about $1,000 per month, leaving money for taxes and insurance and still enough to cover all other living expenses comfortably. The glaring issue is that the median home price in the US is around $420,000, with a mortgage payment of about $2,300 per month.
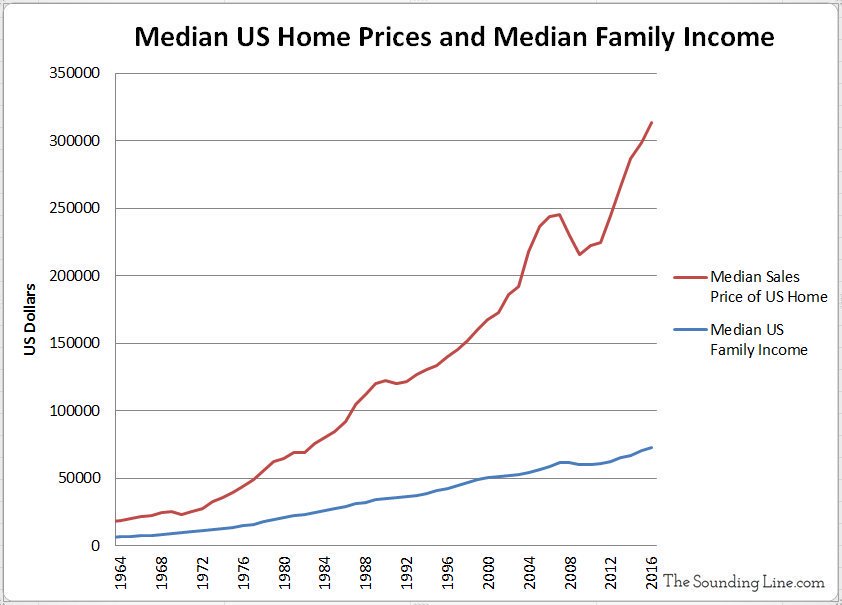
Since 1960 median home prices have increased 121%, with median household income straggling behind with a 29% increase as of 2017. Median rents have increased by 72%.[4]
The South and the Midwest regions of the US are the most affordable regions in the country. In the South, from 1960-2017, the median income increased by 49%, and the median home by 156%. For the Midwest, there was a 29% increase in median household income and an 82% increase in median house prices. These regions are “affordable” compared to the West, which has seen a mere 26% increase in median household incomes with a 195% increase in median home prices. This still looks affordable compared to outlier cities such as New York, Boston, Los Angeles, and San Francisco, that saw incomes increase by 54%, 71%, 32%, and 91%, respectively, while their median home prices went up by 184%, 228%, 358%, and 531%.
A different study looked at the median home prices from 1965-2021, finding that the median home price has risen 118%, while the median household income increased only 15%, a difference of nearly eight times.[5] Adjusted for inflation, since the housing market crash and recession in 2008 house values have increased over three times the rate of incomes. As house values recovered and increased, wages remained flat.
Historically in the United States, a large share of the middle class’ wealth was held in home equity. Now, as the difficulty of home ownership increases with each passing year and decade, the trend of substantial home equity is likely to continue to slow. Homeownership grows more out of reach with each American generation, reflected in lower ownership rates.[6]

This year, after interest rates jumped to 5.5%+ from much lower rates in the 3% range last year, the housing market has cooled after its hot run.[7] As a result of the higher rates, the buying spree has been slightly stemmed for now. In May, sellers started to lower prices on their homes; 15% of listings reduced their asking price. However, year over year, prices are still up 17%.[8] June saw about 15% of deals in contract fall through. The past five years have seen 11-12% of sales not closing.[9] Although this is a welcome sign to many hoping to buy a home or to get a respite from climbing rents, this is a minimal correction on a micro scale for a problem that has been gaining momentum for over 50 years.

You can buy Greg Johnson’s Truth, Justice, & a Nice White Country here
Home values are increasing beyond a function of inflation.[10] The median home in 1980 cost $47,200 and $79,100 in 1990; adjusted for inflation, those prices are $93,400 in 1980 and $101,100 for 1990. During some years, we have seen home price increases outpace inflation by double.[11]
We’ll look at and make a quick note concerning the popular commentary surrounding the housing market trends from a CNN article and a study by King’s College London.
First, there is a CNN article titled “These Entitled Millennials Are Cheering for a Housing Market Crash.”[12] This piece is the typical fare from out-of-touch journalists. Instead of making a good faith attempt to unearth the issues in the housing market and economic landscape most people face, the entitled journalist instead mocks people who are desperately expressing legitimate concerns over housing prices and general instability.
The King’s College London study found that over half of Baby Boomers believe “luxury lifestyle” items are to blame for the younger generation’s inability to buy a home.[13] Although it can be easy to dismiss and hold Boomers in contempt for suggesting that the younger generations merely need to “cut back a little,” I’ll offer a different approach. Boomers, for the most part, live in a world that doesn’t exist anymore. They still believe that if you go to work, work hard, and have even minimal levels of financial discipline, you can relatively easily “make it” in the United States.
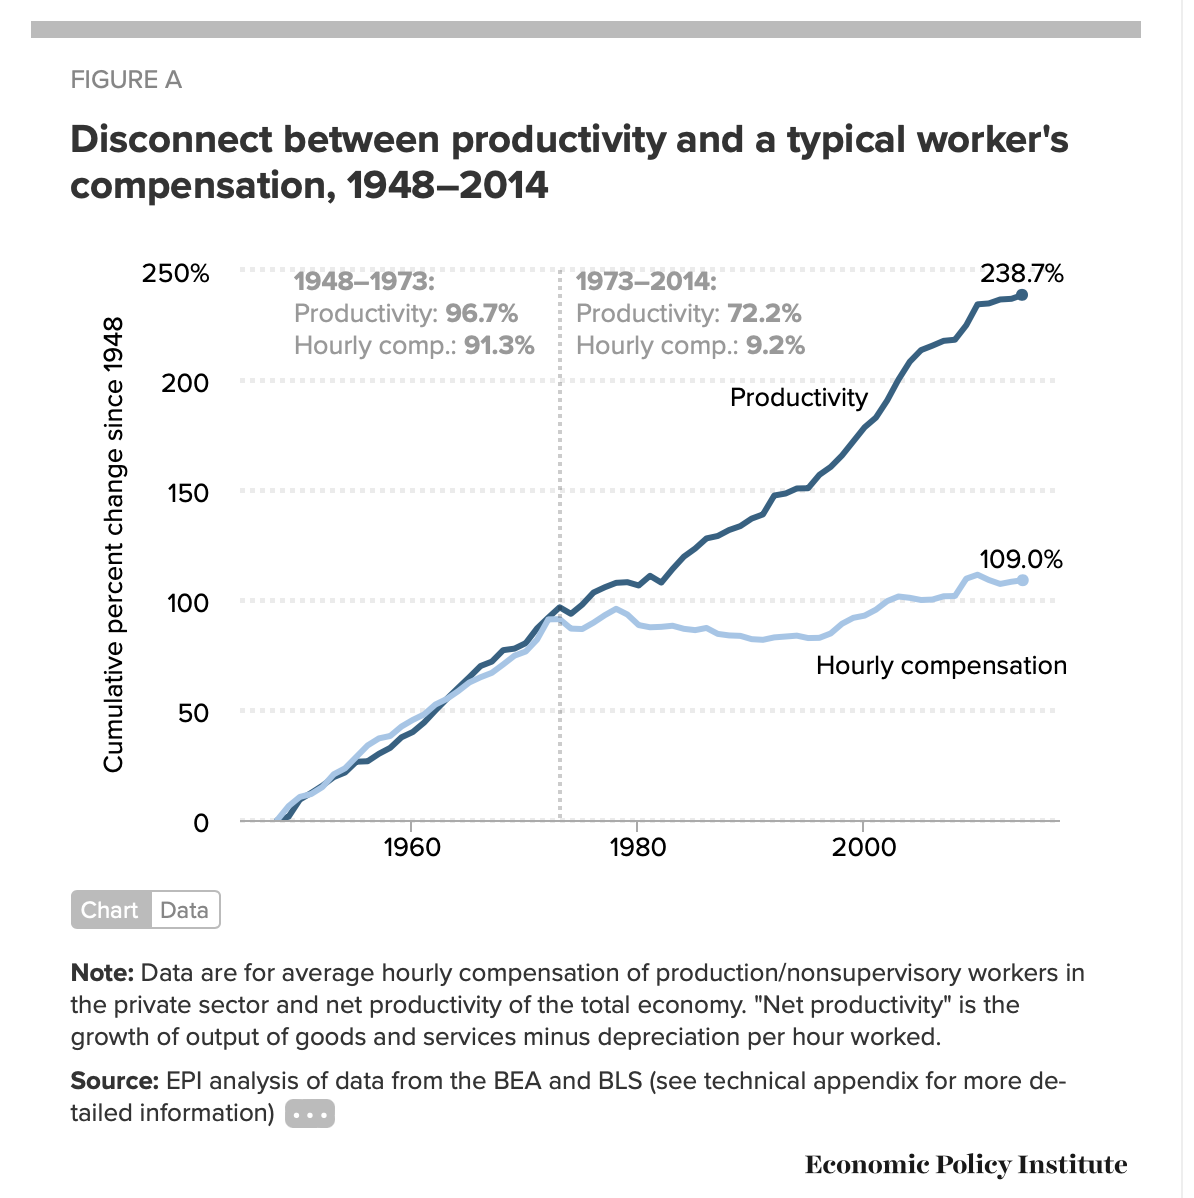
They come from an era when the average home cost was 2.5 times or so the average salary; when wages were still keeping up with inflation, productivity, and company profits; and when the supply of houses was not eaten up by over a million new immigrants per year, who at the same time drive down wages.[14] The world Boomers matured in, worked in, bought houses in, and invested in does not exist anymore. Perhaps at some point in the 1970s, when gas prices and interest rates were high, cutting back on unnecessary luxuries would have been fine advice to someone for remaining solvent and financially stable. However, as we have seen, that world might as well be another country. A country where the average person could count on earning enough money in the next year to at least keep up with rising costs has not been the trend for quite some time now.
Essentially, many Boomers are operating on outdated “rules of thumb” that are becoming increasingly irrelevant. Cutting out coffees and Netflix, and many other small luxuries for that matter, will not add up to an amount anywhere near what is needed to deal with housing costs. Costs are outpacing incomes by more than an entire year’s worth of pay compared to when the Boomers were buying homes for the first, second, or third time.
From Fortune we have, “What causes a recession? Maybe it’s you and how grumpy you are about the economy.”[15] This theory is interesting beyond its inflammatory headline, essentially being an argument that low consumer confidence often precedes an economic downturn and may be causal. The author points to some factors, such as high employment levels, as a reason people should be more optimistic about the economy, which could cause a recession. Two glaring flaws are present: first, assuming that something like low unemployment matters when employed people see their wages being outpaced by the cost of living and inflation; and second, assuming that consumer feelings are baseless and irrational. I do not believe this is the case.
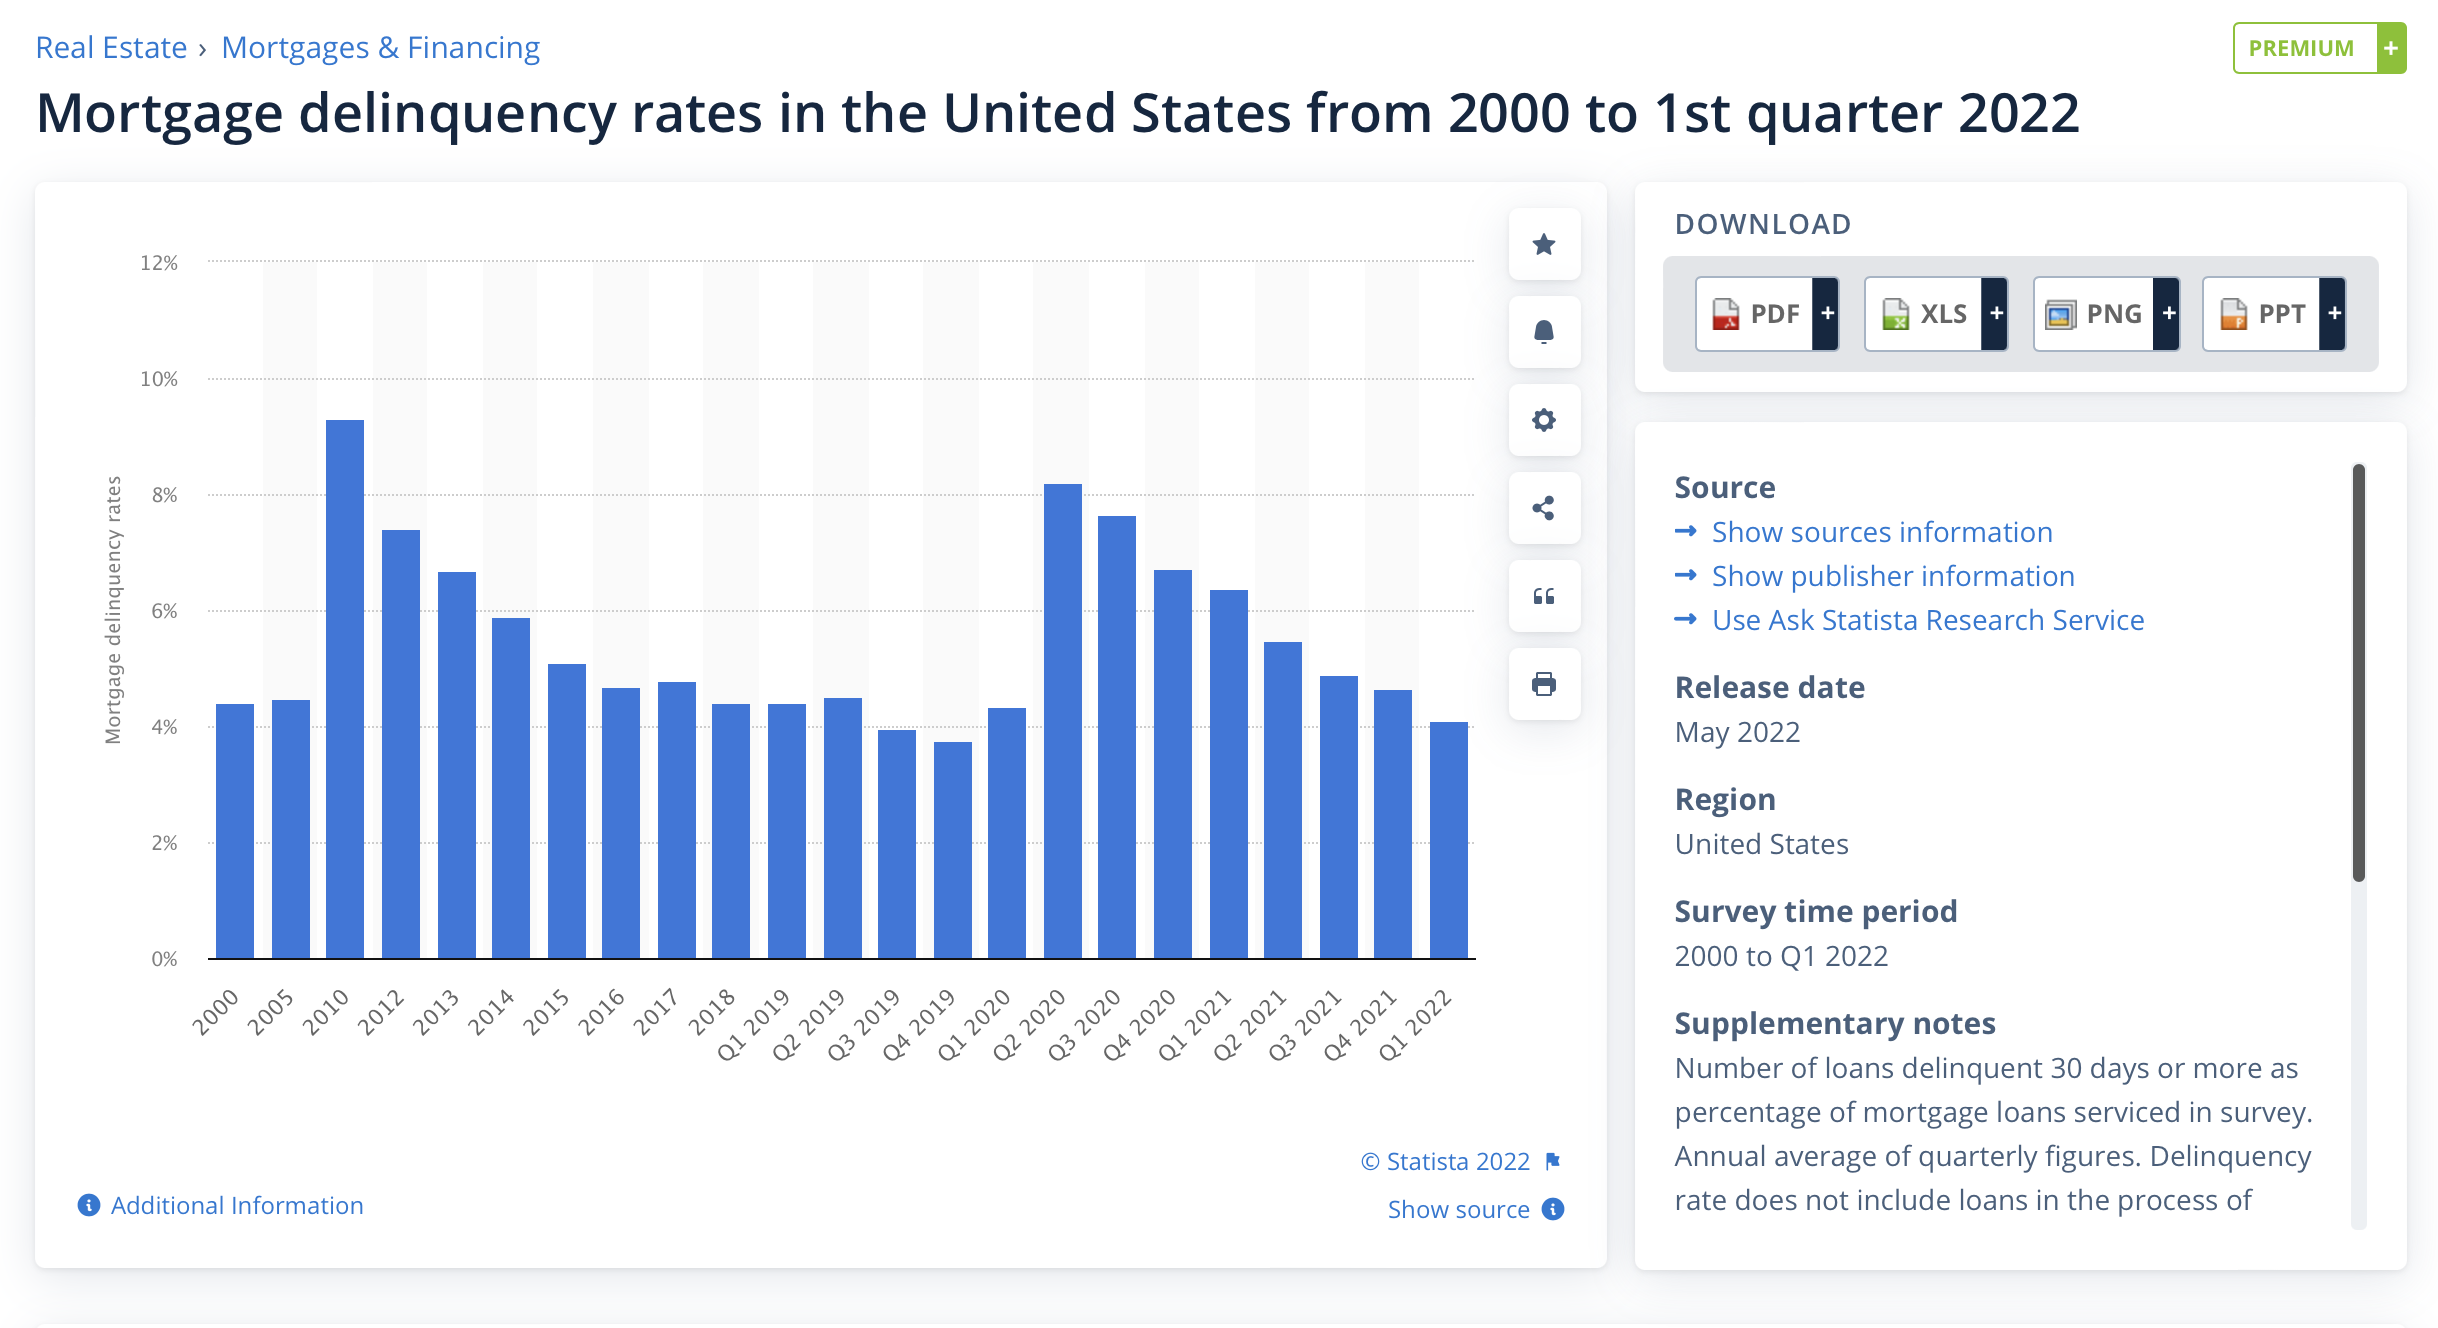
I have seen and heard many comparisons of our present situation to the 2008 housing market. They speculate that this market is another bubble and that prices will fall or crash, providing some relief to those being priced out of ownership and where rent is squeezing them economically. There are several issues with this idea. First, even if prices begin to fall, it doesn’t translate to higher supply. Mortgage delinquency rates are much lower today than in 2008 — one signal that the current trend is substantially different from before. In 2008, people lost homes to foreclosure largely due to lending practices, meaning their homes were returning to market supply while driving down prices overall.[16] Another is that many institutions and foreign investors are now buying single-family homes, adding to the supply shortage, and whose position is presumably much more stable than that of the sub-prime borrowers and their lenders of 2008. Finally, even if there were a 2008-level crash, as we have seen, the home prices would likely recover at a rate outpacing income. Unless the prices crash by a genuinely biblical proportion, such that values are reduced by half or more, the price-to-income ratio would still be such that average Americans will be struggling to afford a home. Not even the 2008 crash itself was able to reset the median price-to-income ratio to a historically “normal” level. Thus, there are minimal signs that a housing crash now would do such a thing.
As housing, utilities, fuel, food, clothing, and transportation costs all rise, at least partly as a function of inflation, the majority (75%) of middle-class households surveyed (those earning $30,000-$100,000 per year) say they are beginning to fall behind.[17]
I have noticed several trends over the past few years beyond low-interest rates that contributed to the heated housing market. We saw dozens of offers on every house for sale in many parts of the country, cash offers well over asking prices, buyers waiving inspections with their bids, and low supply on the market. Several things happened almost all at once: Black Lives Matter riots all over the country that lasted through the summer of 2020, the rise of liberal district attorneys with an incredibly soft attitude towards crime (for certain crimes and specific demographics), Covid lockdown policies, and the institutional mass buying of single-family homes by heavily-funded asset management firms such as the Blackstone corporation. In short, we are in an intersectional dilemma where liberal public policy, black crime, white flight from the cities, and leviathan investment corporations all come together to create a terrible strain on most people.

A country feels less and less like it is “yours” when you can no longer own a home if you’d like. I have seen houses on moderate-sized lots in my area sell for $350,000 or more, whereas comparable houses were selling for $250,000 several years ago, and for half of that around 2008. The liberal urbanite and suburban white flight is always troubling. As the larger cities have seen a wild increase in crime since 2020, the same people who support Black Lives Matter are fleeing the violence and property theft, moving into different suburbs or more rural areas, increasing the housing costs for those who already live there, and then display pride and BLM flags on their new lawns, inviting the exact problems they just fled.
If that was not vexing enough, the exodus from the cities and institutional buyers drive up the housing costs and property taxes along with them, effectively taxing many people out of houses they could once afford due to the increased tangential costs of home ownership.
The World Economic Forum catchphrase “You will own nothing, and you will be happy” stalks us still. Those who have already purchased a home and built equity will likely continue to be pressured by rising property tax rates as homes around them trend upward. The same pressures loom for those who may inherit a home or equity in a house. There have been people I know who have essentially been forced to sell their homes due to rising costs of living and property taxes. With the sale, they may be flush with cash but have nowhere to go, so they will rent, perhaps indefinitely.
According to a 2018 study, a survey of Americans found that 82% of respondents said their idea of the “American dream” is financial security for themselves and their families, with 75% saying that owning a home is part of that dream.[18] The same study reported that a third of those surveyed said the American dream is slipping away. Sadly, I cannot help but agree with that sentiment.
* * *
Counter-Currents has extended special privileges to those who donate $120 or more per year.
- First, donor comments will appear immediately instead of waiting in a moderation queue. (People who abuse this privilege will lose it.)
- Second, donors will have immediate access to all Counter-Currents posts. Non-donors will find that one post a day, five posts a week will be behind a “Paywall” and will be available to the general public after 30 days.
- Third, Paywall members have the ability to edit their comments.
- Fourth, Paywall members can “commission” a yearly article from Counter-Currents. Just send a question that you’d like to have discussed to [email protected]. (Obviously, the topics must be suitable to Counter-Currents and its broader project, as well as the interests and expertise of our writers.)
- Fifth, Paywall members will have access to the Counter-Currents Telegram group.
To get full access to all content behind the paywall, sign up here:
Paywall Gift Subscriptions
 If you are already behind the paywall and want to share the benefits, Counter-Currents also offers paywall gift subscriptions. We need just five things from you:
- your payment
- the recipient’s name
- the recipient’s email address
- your name
- your email address
To register, just fill out this form and we will walk you through the payment and registration process. There are a number of different payment options.
Notes
[1] Skylar Olsen. “Home Buyers Need 7.2 Years to Save Down Payments – 1.5 Years More Than in 1988.” Zillow. October 22, 2018.
[2] “Historical Mortgage Rates and What Today’s Rates Mean for Home Affordability.” My Move. March 11, 2022.
[3] Alexander Hermann. “Price-to-Income Ratios Are Nearing Historic Highs.” Joint Center for Housing Studies of Harvard University. September 13, 2018.
[4] Eylul Tekin. “’A Timeline of Affordability: How Have Home Prices and Household Incomes Changed Since 1960?” Clever. August 3, 2021.
[5] Jessica Dickler. “Home prices are now rising much faster than incomes, studies show.” CNBC. November 10, 2021.
Michelle Delgado. “U.S. House Prices Are Rising Exponentially Faster than Income (2021 Data).” Real Estate Witch by Clever. October 25, 2021.
[6] Laurie Goodman and Jun Zhu. “By 2040, the US Will Experience Modest Homeownership Declines. But for Black Households, the Impact Will Be Dramatic.” Urban Institute. January 21, 2021.
[7] Katie Collins. “Historical Mortgage Rates: Averages and Trends.” Time. July 29, 2022.
[8] Sarah Hansen. “More Home Sellers Are Dropping Their Asking Prices – but Don’t Celebrate Yet.” Money. May 9, 2022.
[9] Patrick Clark. ”Home-Sale Cancellations Jumped in June as Buyers Backed Away.” Bloomberg. July 11, 2022.
[10] Emmie Martin. “Here’s how much housing prices have skyrocketed over the last 50 years.” CNBC. June 23, 2017.
[11] Ryan McMaken. “U.S. home prices are rising twice as fast as inflation.” Business Insider. May 2, 2016.
[12] W. E. Messamore. “These Entitled Millennials Are Cheering for a Housing Market Crash.” CNN. September 23, 2020.
[13] Kieran Gair. “Baby boomers say struggling young should cut Netflix.” The Times. June 13, 2022.
[14] Josh Bivens and Lawrence Mishel. “Understanding the Historic Divergence Between Productivity and a Typical Worker’s Pay.” Economic Policy Institute. September 2, 2015.
Steven Frank. “Gap between corporate profits and wages grows to post-war record.” MSNBC. December 5, 2012.
[15] Will Daniel. “What causes a recession? Maybe it’s you and how grump you are about the economy.” Fortune. June 4, 2022.
[16] “Mortgage delinquency rates in the United States from 2000 to 1st quarter 2022.” Statista.
[17] Sarah O’Brien. “75% of middle-class households say their income is falling behind the cost of living.” CNBC. July 18, 2022.
[18] “Was it only just a dream?” MassMutual. August 21, 2018.


