Select date

The Scientific Basis of Genetic Identity Politics


 4,213 words
Abstract
Previously, I have established the importance of essences in defining an identity and also introduced genes as essentialist particles. The purpose of this article is to update our concepts of human variation by bringing it in line with modern science. This is an important task, as contemporary academia either hides this knowledge via obscurantism or outright lies about it.
Consequently, those sympathetic to our cause have to rely on either amateurs or old textbooks with information that hasn’t been updated for many decades. The result is that our ideas suffer from a legitimacy crisis in the public’s eyes. To address this shortcoming, here I will provide a concise reference text for a more modern model of human variation that reveals the essentialist forces that generate our identity. Modern genomics will help to provide a principled moral and scientific basis for deriving a form that will meet the criteria of essentialism, robustness against deconstructionist attacks, and the requirement that it scales to the millions. Drawing only on mainstream science, I will show that these essential prior forms manifest via distinct axes of genetic variation, which may be used to derive a single quantity to determine group identity.
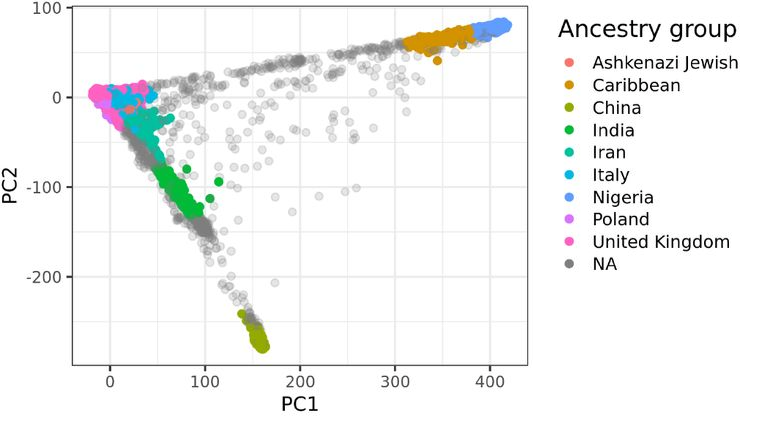
Fig 1 Global human genetic variation.
We need a precise and objective definition of who we are, as we live in a highly moralistic society. To win over the public, we will need to convince them that our position is a moral one since it is based on the truth. This will be extremely difficult, as the idea of a kinship-based group identity has been the subject of over half a century of slander. Modernists have systematically undermined any such position by claiming that it would be both scientifically and morally wrong. The rehabilitation of this concept will require drawing on some of the latest advances in genetics, which will make this article more technical than any of my previous ones. It is necessary to get more technical, as identity and morality in this century will be intertwined with science far more than ever before.
As I argued previously, science has moved so far in our direction over the past two decades that it is now possible to express everything we believe in without having to venture outside the mainstream. This is a vastly preferable alternative to having to rely on controversial scientists, as this will make our position far more robust. This way we won’t have to defend facts, only interpretations. Thus, everything I am about to share here will only draw on mainstream, high-impact, peer-reviewed science journals.
The genetic basis of identity politics

You can buy Greg Johnson’s White Identity Politics here.
I expect that those reading this article already have a sense that there is something innately different between groups of people of various ancestries, and that genes are somehow involved. Most of you will not know the details of this or how to articulate the nature of this difference, however. In the following I will present the relevant minimum knowledge of genetics needed to appreciate human variation.
The human genome consists of around three billion nucleotide bases. Our DNA is organized into close to 20,000 recognized genes, which are regions of the genome that serve a common function, for example to encode molecules or to regulate the behavior of other genes.
The information encoded in these structures determines our physical and mental traits, up to the degree that these are heritable, which is now recognized to be very high for a great many phenotypes.[1] Out of the three billion bases, we already know that close to 100 million of them can vary between people,[2] and as we keep sequencing more individuals, we keep discovering ever more variation.[3] These sites (loci) of the genome exist in alternative forms at different frequencies, which are called alleles. These alleles are most commonly single nucleotide polymorphisms (SNPs), or alternatively they may be multi-nucleotide variants. Thus, when someone talks about having a different “gene for X”, this is colloquial, as they usually refer to having an alternative allele for a shorter variant, usually just an SNP, rather than an entirely different gene.
Population structure and genetic variation
The foundation of genetic identity politics is the realization that the aforementioned over 100 million variants’ frequencies present in our species differ between populations, thus making them systematically more or less genetically similar to each other.
This population structure across many loci can be revealed via dimensionality reduction techniques, which show how millions of variants form systematic patterns. There are many such techniques that all reveal similar prior structures, however. The most popular classical way to do this is via Principal Component Analysis (PCA). PCA is a mathematical method for identifying the largest sources of variation in a dataset, which is accomplished by summarizing the axes of variation into a reduced set of orthogonal variables (see the Appendix for more details). PCA thus distills vast amounts of genetic variation into a few meaningful variables that capture the essences of human variation. These values are called Principal Components (PCs), and populations are routinely visualized via scatter plots of the first few PCs. Visualizing the space described by the first two PCs, which usually explain ~10% of the total variance that differentiates continental populations,[4] will produce an image similar to Fig 1.[5] In turn, visualizing the third and fourth PCs will produce an image similar to Fig 2, which reveals finer population structure within continents. While usually only the top few PCs are presented, in fact up to several hundred PCs could capture meaningful variation in a diverse population.[6]

Fig 2 Higher PCs reveal finer scale population structure.
The meaning of PCA
So, what do these plots and quantities mean conceptually? Although frequently generated, the actual meaning of these plots is rarely explored. Considering them in detail will provide the starting points for our new model for human variation, however.
The X and Y axes of these plots are the PCs I have described above, and the colored dots are the individuals in the study. There are two very important observations that arise from this. First, the individuals and groups that are spatially closer to each other in the plot are genetically more similar to each other across their entire genome than individuals further away (on those PCs). Second, the X and Y axes are obviously perpendicular, which is due to the orthogonal nature of PCA. This fact is of particular importance, which will be highlighted momentarily.
The PCs themselves can be thought of as the essences of populations. The fact that each person is made up from many such PCs reveals us to be more akin to a harmony, rather than essences as according to Plato’s unitary definition of a soul. However, the PCs themselves still satisfy the definition of an essence as they represent the underlying fundamental nature of what a population is. The fact that we are made up of multiple such essences also takes care of Aristotle’s critique of Platonic forms (which is based on the observation that single objects could have many essences), without undermining the essentialist basis of a genetic identity.
Human genetic variation and essentialism
One of the main allegedly required properties of essentialist identities is a sense of discreteness. In other words, homogeneous identities ought to manifest as non-overlapping discrete types. This is clearly not the case for humans, as all populations show continuous variation, where the different clines smoothly blend into each other. As this point is the basis of the most popular anti-essentialist argument used against us today,[7] this problem deserves special attention.
To resolve this issue, consider the fact that the PCs are orthogonal, i.e. at right angles to each other. Orthogonality can be considered as an adequate substitute for discreteness, as these are conceptually related properties given that they both imply a discontinuous change in variation. So while a discrete population of Europeans or Africans may not exist, we can still recognize that someone is essentially “more European” or “more African” in relation to others, as the axes of these variations were defined orthogonally. To appreciate this, consider Fig 3, which visually demonstrates orthogonality as essential variation through the well-known rainbow metaphor.
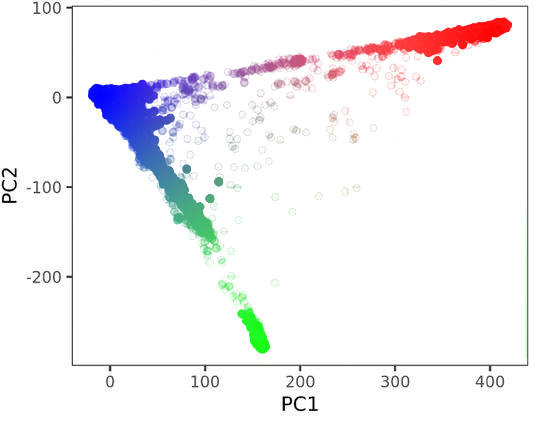
Fig 3 PCA of genetic variation colorized by distance from the three population centers.
The above plot shows the same global genetic differentiation of the previous dataset with individuals colored by their distance to their population centroids (these will be defined later). The PCs represent orthogonal change, yet the resulting variation results in a smooth gradient. From the fact that these two properties are simultaneously true, we can conclude that a smooth blending does not invalidate the existence of essentially different colors, or peoples.
The scale of human variation
I have shown that given the known patterns of genetic variation, individuals are essentially different, and that within a descent group, people are more similar to each other than to outgroups. This is already a significant result, as most of the public aren’t even aware of this. Some even believe that two Europeans could be less genetically similar to each other than either of them to someone from Africa, which should now be clear could never happen. We still haven’t addressed the question of scale, however. What is the scale of this similarity? How important is that 10%, within continental similarity? It certainly looks a lot smaller than the 90% where everyone is different. The mainstream view is that even if the pattern of similarity is how I described it, it does not matter, as any differences are so small that they must be trivial. After all, aren’t we all over 99% genetically the same?
First of all, the fact that we are all over 99% identical is relative. We may all be very similar relative to a non-human species, but from our own point of view, only the fraction where two humans can differ matters, as only those parts of the genome could contribute to human variation. This remaining fraction is what makes our children resemble us to the extent that they do, which is appreciably greater than a random member of the population. Thus, if you consider your resemblance to your relatives important, then global human genetic variation is non-trivial for the very same reasons as well.
Second, that 10% figure is outdated. More modern methods that accommodate natural populations with internal structure reveal global human genetic differentiation to be far higher, at 26%. But how important is that 26% in actuality? Can we put these numbers into perspective to make them more relatable? To do this, I will first have to briefly introduce the technical version of kinship. Genetic kinship is a probabilistic metric for genetic similarity between two individuals, with a series of established thresholds for known relationships. For example, kinship coefficients of 0.5, 0.25, and 0.125 refer to identical twins, first degree, and second degree relatives, respectively.
But what does this have to do with population structure? The aforementioned global genetic differentiation, the 26% of variance figure, is measured on the same scale as kinship.[9] Thus, that 26% figure actually suggests a stronger than first degree relationship. Let me repeat this in another way to make it absolutely clear. Two randomly-picked individuals from across the globe are as different from each other genetically as you are similar to your own children, parents, or siblings. So instead of it being trivial, human genetic variation is actually quite substantial.
Why does genetic differentiation matter?
So far, we have established that individuals genetically resemble their descent groups at a scale similar to that of close relatives. But why does it matter that the chemicals in our cells are potentially more similar within a population than between them?
It is important since genomic relatedness shows a roughly linear relationship with phenotypic similarity[10] within a population. Thus, basic quantitative genetic theory predicts that if populations show a genetic differentiation of a similar magnitude to first degree relatives, then one would expect their phenotypic differentiation to be of the same scale as well. This will hold true as long as the traits in question have a non-zero heritability.
You can buy Greg Johnson’s The White Nationalist Manifesto here
For a single trait, the phenotypic differentiation would be expected to be proportionate to the genetic variance attributable to ancestry (26%). From this we could conclude that, for one (selectively neutral) trait, the expected distributions between populations would overlap.[11] Once all phenotypes are considered across the full spectrum of personality traits, however, the populations would become more differentiated. The overall pattern of phenotypic variation would therefore be expected to approximate the structure revealed by the genetic PCA plots.
The above may sound obscure, so I hope that the following concrete example will clarify it. Many academics focus on IQ, which is an undoubtedly important trait. Cognition is just the tip of the iceberg, however. Currently, we cannot yet say with certainty how much of the IQ differences between ancestries are due to genetic causes. In any case, the mean difference in IQ scores is small enough that population distributions of the genetic endowment for intelligence would overlap, anyway. However, if we expand beyond IQ to consider the whole person, by taking all phenotypes jointly, the overlap in overall phenotypic similarity will decrease as a function of the overall genetic differentiation with the addition of each new trait.
The fact that groups of people that are substantially genetically different will therefore also inevitably result in that they will be, on the whole, substantially phenotypically different as well.
The correspondence between genetic population structure and self-identified ethnic labels
So far we have established that patterns of population structure create genetic similarity, and that this in turn creates phenotypic similarity. But to connect any of this to politics, we will need to examine the correspondence between the genetic identities revealed so far and popular labels for ethnic identities. For example, is there any genetic basis for being “black” or “white”?
First, we have to clarify that the patterns we have identified so far are prior forms, independent of any labels the researchers may attach to them later. This is an important fact, as certain anti-essentialist attacks on these identities are based on the postmodern idea that the patterns in such data are somehow inserted by the researcher, or perhaps they were created by the model’s parameters.[12] These arguments exemplify the postmodern fallacy, which asserts that there is no objective reality independent of the observer. This is categorically false. You can also verify this yourself, as I have included all the relevant technical details needed to show that the model is entirely agnostic (see the Appendix).
Depending on how the populations were sampled, the order and the details of the estimated PCs may vary in a given study, but across all studies the same PCs are revealed as the natural essences of these populations’ a priori forms. The name of the labels attached to them are of course arbitrary, but they are just names for pre-existing patterns, which can be anything. In practice they follow commonsensical rules, and tend to correspond to the study participants’ ancestral origins.
What about self-identified ethnic labels? A common naïve criticism is that there is no relationship between what people identify as and their genetic ancestry. This is, of course, also false. Barring individual exceptions of edge cases, what people believe themselves to be also tend to closely follow the underlying genetic patterns. Here is a plot that overlays a histogram of the participants’ self-identified ethnicity with the first two PCs:[13]
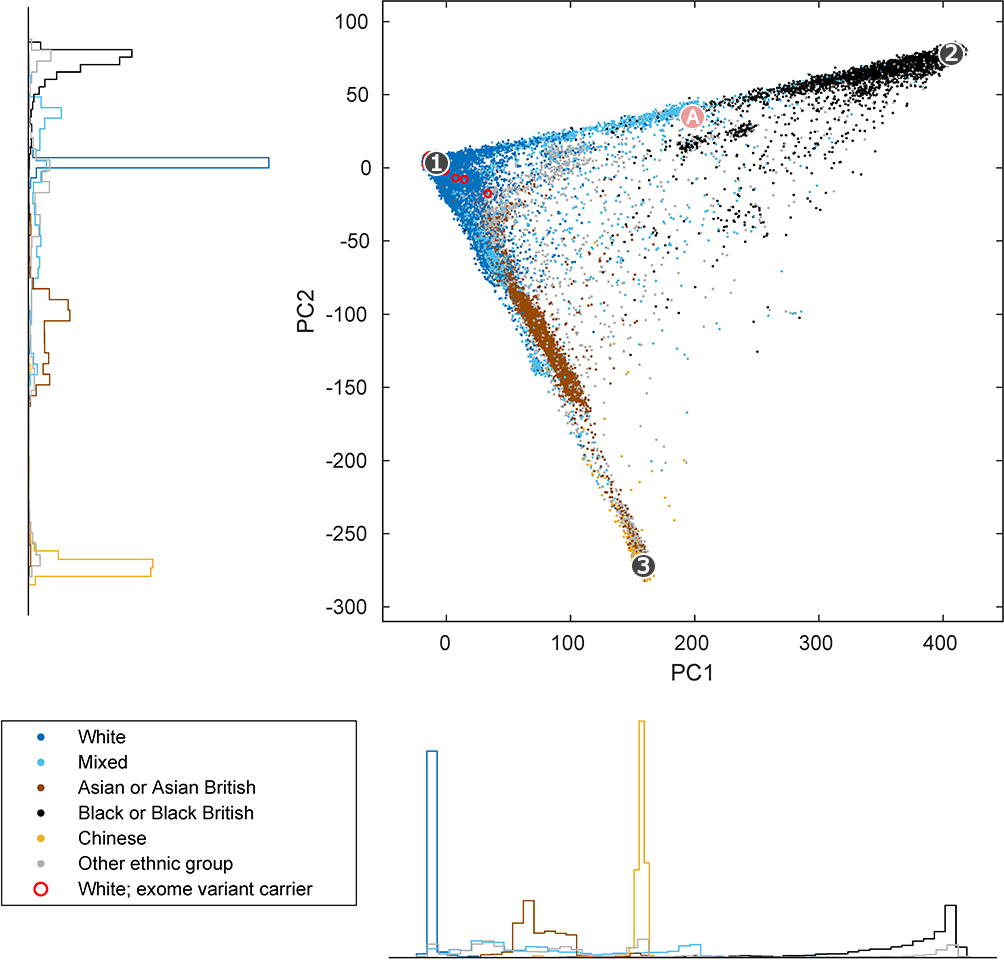
Fig 4 The association between genetic variation and ethnic labels.
The above should convince anyone that there is a strong, broad correspondence between popular ethnic labels and the underlying genetic population structure. Of course, common sense dictates that the former was derived from the latter via a process of thresholding continuous variation into discrete categories. The fact that the lines for black or white would be drawn differently in different cultures — for example, in Brazil the “one drop rule” is much relaxed — would simply imply that a different thresholding scheme was applied to the same underlying prior structures. As I argued beforehand, the reality of human genetic differences is invariant to error-prone human perceptions; thus, calling the same thing by different terms does not alter the prior facts at all.
Thus, we should not find it surprising that people who believe themselves to be black are predominantly genetically African and those individuals who self-identify as white are mostly genetically European.
Determining individual genetic identity
The one remaining important objective is to derive a scheme to quantify an arbitrary individual’s genetic identity. At last, this is actually a straightforward task, which has been performed thousands of times in virtually all genetic studies that involved large populations.[14]
In brief, the way this is usually accomplished is by computing a centroid for each reference population as an ideal against which participants will then be measured. A centroid is simply the average (or median) of all individuals in the reference population computed across all PCs. Conceptually, a centroid can be thought of as the Platonic essence of a population; that is, the “ideal type.” One can therefore obtain the genetic identity of any individual by simply measuring their genetic distance from their nearest population centroid(s), and determine their identity as belonging to one or more of the reference populations at a given percentage.
To illustrate this graphically, consider the three example centroids shown as (1), (2), and (3) in Fig 4. The individuals closest to (1), (2), and (3) are the most European, African, and East Asian persons, respectively. In turn, individuals near (A), who are in an intermediate position
between the centroids (1) and (2) along the European-African cline, have a genetic identity correspondingly intermediate between the aforementioned two. The real calculation is only slightly more complex, as that would factor in the rest of the PCs as well. On the whole, however, determining genetic identity is a relatively simple, intuitive process.
In closing, I will also have to address two philosophical concerns. The first is the charge that computing genetic identity as a single number would be “reductionism.” In fact, dimensionality reduction is in many ways quite the opposite of moral reductionism. Moral reductionism would be to attempt to determine our form via a few, potentially superficial properties. In contrast, the process I described here reveals a form that draws on our whole genome, which captures our essence as shaped by hundreds of thousands of years of evolution. To see beneath the apparent chaos and to identify the essences that motivate our underlying true nature, dimensionality reduction is not a hazard, but a requirement. Thus, the accusation of moral reductionism is baseless.
The second concern is that identifying our form via genes would be a type of materialism. This is also an inappropriate way to think about our identity. A better way to approach this issue is via the recognition of the continuum that exists between matter and higher-order abstractions like culture. According to this view, such higher-order phenomena are the emergent properties of their lower-order bases. This recognition of a continuity is in contrast to modernity’s dualism, which falsely believes that our culture and civilization could continue to exist after cutting it off from its biological roots.
Conclusion
We have now developed a more modern, scientific understanding of human variation. This can be summarized by the following four points:
- Individuals are always more genetically similar to their own descent groups than to outgroups.
- As genes are essentialist particles, and that variation is orthogonal, (1) is true in an immutable, essentialist sense.
- The magnitude of global human genetic variation is on the same order as similarity between first degree relatives.
- This genetic similarity is also expected to generate corresponding phenotypic similarity of a similar magnitude.
The state-of-the-art process outlined in this article can be deployed to identify the essences of our form, even down to a sub-population level. It can be used to distinguish Poles from Brits and the Brits from Italians, all of whom can be clearly distinguished from foreign forms such as Ashkenazi or African populations. It may seem like an arduous, overly complicated process to derive something that everyone feels they instinctively know already. However, there is a world of difference in the end result: The above derivation yields an entirely objective and morally sound identity that may be replicated with ease. Scaling it to millions of individuals via automation can therefore be a simple, straightforward process. Thus, unlike anything that has ever existed before, this identity will hold, and may become the gold standard for membership in large groups or organizations.
The moral and social implications of genetics are at the center of our culture’s blind spot today. A combination of profound ignorance and phobia of heredity is at the root of all the problems that plague our societies. The general public, and especially the intelligentsia, refuse to acknowledge the power of the genome and the fact that genes exert such a dominant force on the human condition. But once they come around, combined with the fact that every living person will know their true genetic identity, these developments will transform politics beyond all recognition. Indeed, if the facts in this article were more widely known, many of our troubles would disappear within a few years.
While it may take another generation for this knowledge to reach the general public, most of the technology is already available to us today. For less than a hundred dollars you can obtain your own genetic information and start to familiarize yourself with the ecosystem of consumer genomics. In a future installment of this series, I will go further and show you how to obtain and interpret your genetic identity from personal genomics companies, and what you will be able to do with it today and in the coming years.
Appendix: PCA method details
To perform PCA, both the individuals and the genetic variants selected must be appropriately chosen.[15] The n individuals must be unrelated and representative of the full genetic diversity of all populations, which should be of comparable sizes. In turn, the p variants have to be in linkage equilibrium and large in number to cover the entire genome (routinely over 100,000 or more). This then forms an n x p matrix (X) of genetic data with individuals on n rows and the genetic variants in p columns. Next, K, the pairwise variant similarity matrix is calculated (K=XTX), which is a p x p matrix. This is then subjected to eigen decomposition (K=VDVT), which identifies the orthogonal axes of genetic variation, where V holds the eigenvectors in its p columns in decreasing importance, and D are its corresponding eigenvalues. Finally, to obtain the Principal Components (PCs), denoted as Z, the individuals are “projected” into this space via a multiplication of their genetic data by the eigenvectors (Z=XV).[16] The first two columns of Z correspond to PC1 and PC2, the third and fourth to PC3 and PC4, and so forth. Visualizing these as scatter plots will produce images similar to Fig1 and Fig2.
* * *
Counter-Currents has extended special privileges to those who donate $120 or more per year.
- First, donor comments will appear immediately instead of waiting in a moderation queue. (People who abuse this privilege will lose it.)
- Second, donors will have immediate access to all Counter-Currents posts. Non-donors will find that one post a day, five posts a week will be behind a “Paywall” and will be available to the general public after 30 days.
- Third, Paywall members have the ability to edit their comments.
- Fourth, Paywall members can “commission” a yearly article from Counter-Currents. Just send a question that you’d like to have discussed to [email protected]. (Obviously, the topics must be suitable to Counter-Currents and its broader project, as well as the interests and expertise of our writers.)
To get full access to all content behind the paywall, sign up here:
Paywall Gift Subscriptions
 If you are already behind the paywall and want to share the benefits, Counter-Currents also offers paywall gift subscriptions. We need just five things from you:
- your payment
- the recipient’s name
- the recipient’s email address
- your name
- your email address
To register, just fill out this form and we will walk you through the payment and registration process. There are a number of different payment options.
Notes
[1] Polderman TJC, Benyamin B, de Leeuw CA, Sullivan PF, van Bochoven A, Visscher PM, et al. Meta-analysis of the heritability of human traits based on fifty years of twin studies. Nature Genetics. 2015 May 18;47(7):702–9.
[2] The 1000 Genomes Project Consortium: A global reference for human genetic variation. Nature. 2015 Sep 30;526(7571):68–74.
[3] Sherman RM, Forman J, Antonescu V, Puiu D, Daya M, Rafaels N, et al. Assembly of a pan-genome from deep sequencing of 910 humans of African descent. Nature Genetics. 2018 Nov 19;51(1):30–5.
[4] Hunley KL, Cabana GS, Long JC. The apportionment of human diversity revisited. American Journal of Physical Anthropology. 2015 Dec 1;160(4):561–9.
[5] Privé F, Aschard H, Carmi S, Folkersen L, Hoggart C, O’Reilly PF, et al. Portability of 245 polygenic scores when derived from the UK Biobank and applied to 9 ancestry groups from the same cohort. The American Journal of Human Genetics. 2022 Jan;109(1):12–23.
[6] Wainschtein P, Jain D, Zheng Z, Aslibekyan S, Becker D, Bi W, et al. Assessing the contribution of rare variants to complex trait heritability from whole-genome sequence data. Nature Genetics. 2022 Mar;54(3):263–73.
[7] Lewis ACF, Molina SJ, Appelbaum PS, Dauda B, Di Rienzo A, Fuentes A, et al. Getting genetic ancestry right for science and society. Science. 2022 Apr 15;376(6590):250–2.
[8] Ochoa A, Storey JD. New kinship and FST estimates reveal higher levels of differentiation in the global human population. 2019 May 30;
[9] Balding DJ. Likelihood-based inference for genetic correlation coefficients. Theoretical Population Biology. 2003 May;63(3):221–30.
[10] Kemper KE, Yengo L, Zheng Z, Abdellaoui A, Keller MC, Goddard ME, et al. Phenotypic covariance across the entire spectrum of relatedness for 86 billion pairs of individuals. Nature Communications. 2021 Feb 16;12(1).
[11] Edge MD, Rosenberg NA. Implications of the apportionment of human genetic diversity for the apportionment of human phenotypic diversity. Studies in History and Philosophy of Science Part C: Studies in History and Philosophy of Biological and Biomedical Sciences. 2015 Aug;52:32–45.
[12] Winther RG. The Genetic Reification of “Race”? A Story of Two Mathematical Methods. Critical Philosophy of Race. 2014;2((2):204-223).
[13] Loh P-R, Genovese G, McCarroll SA. Monogenic and polygenic inheritance become instruments for clonal selection. Nature. 2020 Jun 24;584(7819):136–41.
[14] 14. Buniello A, MacArthur JA, Cerezo M, Harris LW, Hayhurst J, Malangone C, et al. The NHGRI-EBI GWAS Catalog of published genome-wide association studies, targeted arrays and summary statistics 2019. Nucleic Acids Research [Internet]. 2018 Nov 16;47(D1):D1005–12.
[15] Privé F, Luu K, Blum MGB, McGrath JJ, Vilhjálmsson BJ. Efficient toolkit implementing best practices for principal component analysis of population genetic data. 2019 Nov 14;
[16] Abegaz F, Chaichoompu K, Génin E, Fardo DW, König IR, Mahachie John JM, et al. Principals about principal components in statistical genetics. Briefings in Bioinformatics. 2018 Sep 14;20(6):2200–16.


